 How To Use Data To Improve Your Charter School’s Enrollment
Data is impacting all facets of education, including charter school enrollment efforts. The use of data-driven instruction is on the rise in schools across America. According to a recent survey of over 1,500 educators conducted by Kahoot! in 2018, almost 75 percent of teachers identified data-driven instruction as the top trend in how ed-tech is being used at their school.
Effectively utilizing data is important in delivering tailored and targeted educational approaches, and it is extremely important in developing a robust and effective enrollment management system. But many charter schools still struggle with using data to shape, inform and improve their enrollment.
If you are new to enrollment marketing for your charter school, or just looking to improve the effectiveness of your use of data, here are five ways that you can successfully use data to improve your charter school’s enrollment.
1.) Develop your overall data strategy
The first step in building a strong data strategy is to identify all the things that you want your data to tell you. When I was in brand marketing, we called this a list of IWIKS or (I Wish I Knew). In this planning stage write down all the things that, if you knew them, would allow you to be a stronger enrollment marketer. Some of these would be:
- Enrollment trends over the past five years
- Retention trends over the past five years
- Marketing tactics that bring in the most prospective parents
- Customer satisfaction rates
- What school is your biggest “feeder”, or source, of students
This list will be long, and since you are in the brainstorming phase, don’t be alarmed if it takes a page or two.
Next, figure out where to get this information.
- Is it currently in your student information database?
- Is this additional data you need to figure out a way to gather?
- How hard would it be to gather that data?
- Assign a source for that data.
For all the pieces of data that you want to know, ask this question: “Is knowing the answer to this question relevant to my job and is it actionable”? If the answer is no and it is just an interesting tidbit of data, don’t waste your limited time figuring out a way to gather it.
Now that you know what you are trying to gather, it is important that your data gathering process allows for good analysis. You have heard the phrase, “Garbage in, Garbage out”? Make sure that the ways in which you gather the data (input from the office administrators, online forms, transfer information, etc.) is clean and follows a standard and consistent data structure.
For example – let’s say that you are trying to analyze what schools are your best sources for students. Knowing this allows you to focus your recruitment efforts to create deeper relationships with those schools. Having clean data makes sure that you are spending your time engaging in relationship building efforts rather than cleaning the data. If your registrar or school admin doesn’t use a standard name for each school, you may not clearly understand your “feeder patterns. Or at the very least, you will have to spend time cleaning up the data rather than engaging with prospective new families.
Hopefully, you will be spending more of your time analyzing data rather than collecting the data. Ensuring that the data you gather is clean and usable will go a long way towards making your analysis – and your job – easier.
2.) Establish your foundational metric #1: Enrollment trends
Many schools that I have worked with have a good understanding of how last year’s enrollment performed. However, enrollment should not be viewed as a snapshot, but rather as a trend. Go back and chart your enrollment over the past five years to see how your total enrollment has fluctuated over time.
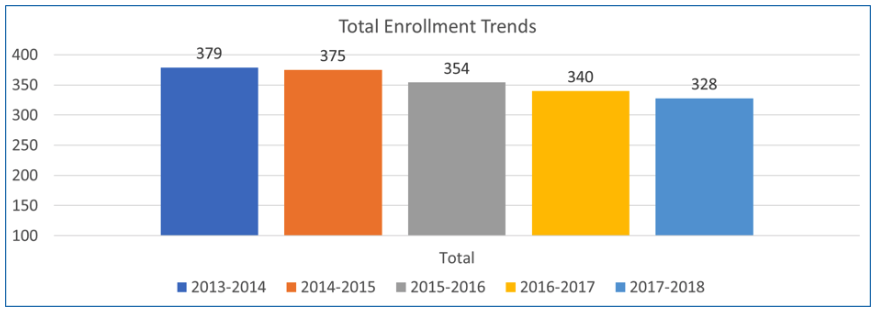
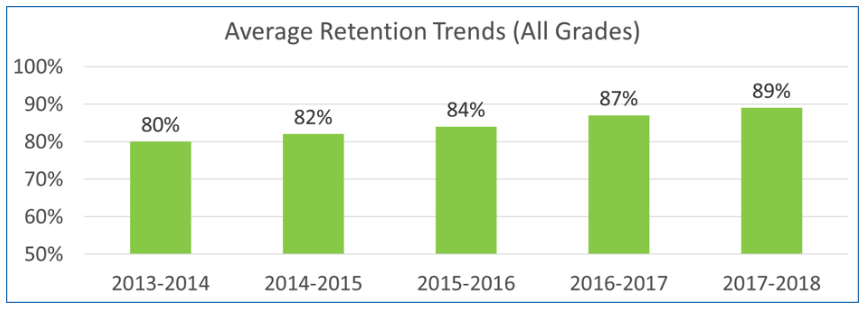
Now add to this, your total new students per year and break out which grade level they enrolled in with an emphasis on your entry grade (K if you are a K-8 school and 9 if you are a high school.) You should end up with a series of graphs like these:
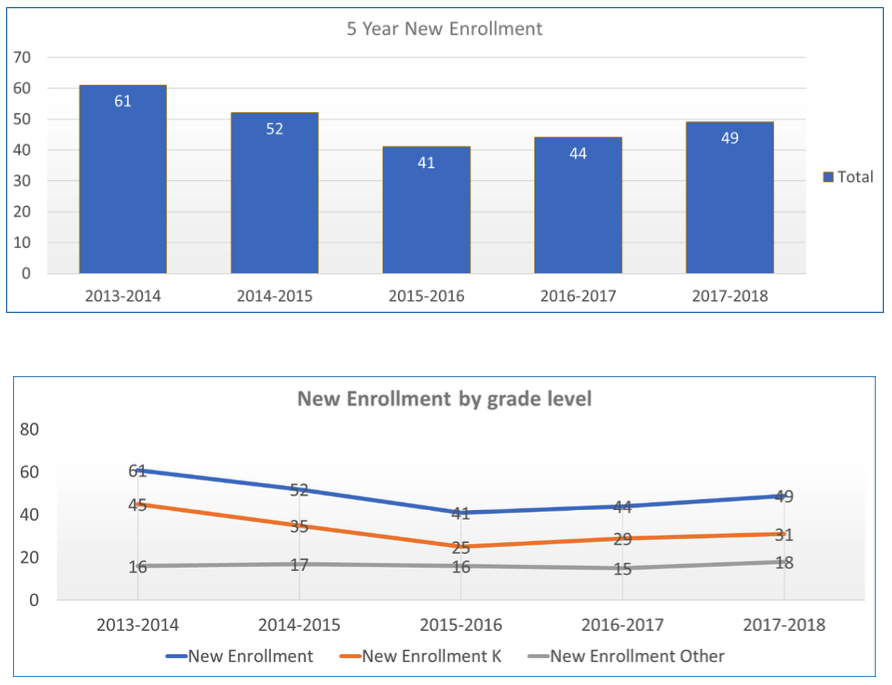 By going through this exercise, you have identified where your school’s enrollment challenge is. In this example, almost 100 percent of this school’s declining enrollment can be attributed to lower kindergarten numbers. Analyzing the data allows this school to focus their enrollment marketing efforts on boosting the enrollment numbers for kindergarteners and not be as concerned about the other grades—which are consistently bringing in approximately the same number of students.
3.) Establish your foundational metric #2: Retention trends
For retention, there is a similar process. Track the five-year retention rate for your school and then repeat the process by grade. Understanding retention data can be tricky. Do you analyze if a student came back after the summer, or if they left in the middle of the year? When you are starting out, I suggest that you look at students who started on day 1 in year 1 and were they enrolled on day 1, year 2?
Now, break out each individual grade’s retention rate.
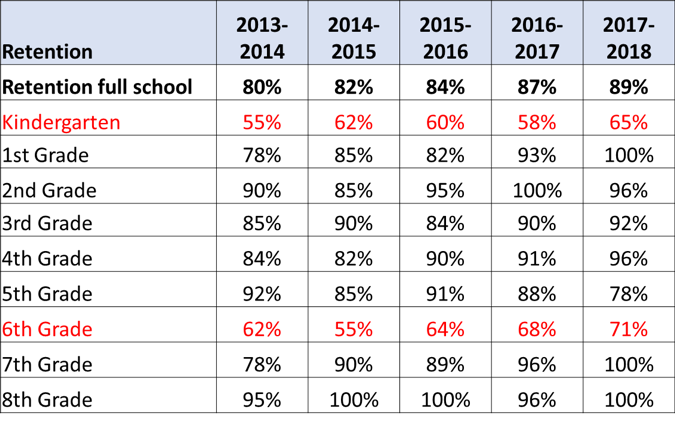 In this example, even though the school’s overall retention grade is increasing, there are still two problem grades: Kindergarten to 1st grade and 6th to 7th grade.
This analysis tells you what, but it doesn’t tell you why. Is it a teacher issue, or maybe competition for 7th graders coming from a strong public middle school? This might be call for further analysis, but even this small exercise allows the school to identify the need to drive retention programs for those two grades since they represent the biggest opportunity.
4.) Know your school’s closure rate
The next most critical metric to track is your school’s “closure” or “yield rate”. This is the number of families who engaged with your school via a school tour or shadow day, divided by the ones that ultimately enrolled in your school.
This is one of the most critical metrics to track and one of the most critical to do right. Here is how it should look if we are only looking at open house attendance:
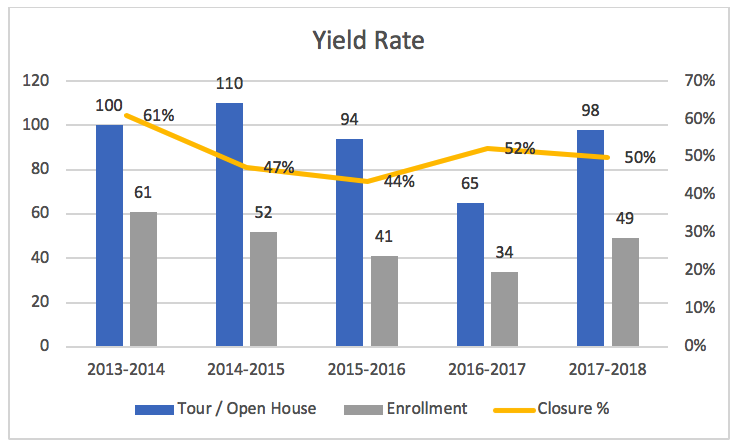 You can see in the example above that this school is averaging around a 50 percent closure rate. For every 100 families that come in and tour the school, only 50 will enroll. If you know this, and are trying to increase your enrollment to 100 students a year, there are two choices:
- Increase the number of families that tour your school to 200. You can do this, but you will probably have to spend a fair amount of money to double your attraction. Or . . .
- Improve your closure rate by “closing the deal” with more of the families (parents) that come to tour.
This chart throws into sharp relief where you need to focus your attention: increasing the quality of the experience a family has when they tour your school. Cutting the data this way allows you to identify your biggest opportunity to drive your charter school enrollment.
Unfortunately, this yield-rate tracking doesn’t tell you why. This might be when you want to consider engaging a “secret shopper” to identify why your tour is not getting parents to convert by enrolling their children.
5.) Try to track the effectiveness of your outbound marketing efforts
Tracking your specific enrollment marketing efforts is the hardest metric to get right. There is an old line in consumer marketing, “I waste 50 percent of my advertising dollars, but I don’t know which 50 percent”. It is often hard to know what specific thing drove enrollment. For example, most schools use yard signs to raise awareness for their upcoming open houses. Does a yard sign make a parent engage with you? It is hard to say, but this is a good example of a cost-effective way to raise awareness.
For a small-budget item like a yard sign, it is ok if you don’t know the direct effects. But if you are planning on spending more money on radio, TV or billboards, having a way to track the effectiveness of those campaigns is critical.
Because it is so important to track your marketing program’s effectiveness, I tend to recommend to clients that they shift more of their marketing dollars to digital, or online advertising. Digital advertising allows you to track engagement and, most importantly, if the customer acted as a result of your marketing efforts. You know if somebody clicked on a Facebook Ad. If you are running a digital campaign and all your “calls-to-action” lead the parent back to a custom landing page to sign up for your open house, you are easily able to track which one worked and led to the highest engagement. You don’t get that same proof of engagement with a billboard. Digital ads can also be very targeted. You can ensure that only parents within your designated age range and zip codes see your ads. This is not really something you can do with broader consumer-based ads like magazines, radio, or billboards.
It can be hard to start the process of using data-driven practices for your charter school enrollment strategy. However, understanding your data allows you to make better decisions, and ultimately, it pays off by improving your school’s numbers.
 Digital Marketing for Charter Schools: An Actionable Workbook to Help You Achieve Your School’s Goals!
Want to improve your charter school’s enrollment but are scratching your head as to how to go about implementing digital marketing for your charter school? You’re not alone! This free manual will be your go-to guide for all of your school’s digital marketing needs! Download this actionable workbook to help get your marketing plans started, guide you as you define your audience and key differentiators, choose your tactics, and start to build your campaigns.